Mastering Pump Curves: Flow, Head, and Efficiency Explained
Pump curves tell you exactly what a pump will do under real operating conditions. They plot flow rate against head, efficiency, and power draw, giving you the data needed to match equipment to system demands. At Shanghai Yimai Industrial Co., Ltd., we see these curves as the starting point for every pump selection decision. Getting this right means lower energy bills and fewer maintenance headaches down the line.
What Pump Curves Actually Show You
A pump curve is a graphical snapshot of performance. It maps how flow rate, total dynamic head, efficiency, and power consumption relate to each other across the pump’s operating range. For industrial applications, this information drives equipment selection. The curve reveals where a pump operates most efficiently and where it starts struggling.
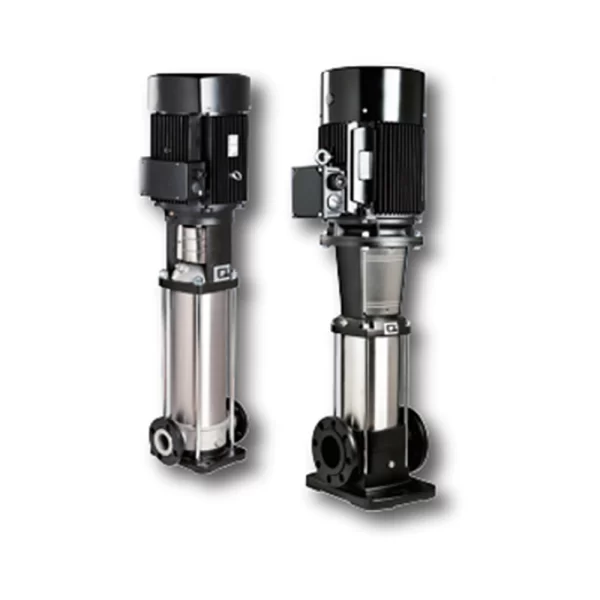
The operating point sits where the pump curve intersects the system head curve. This intersection tells you the actual flow rate and head the pump delivers in your specific piping arrangement. Miss this point during selection, and you end up with cavitation, excessive vibration, or wasted energy. Shanghai Yimai’s product range, including our Vertical Multi Stage Centrifugal Pump and Split Casing Double Suction Pump, comes with detailed curve data for precise application matching.
Flow Rate and Total Dynamic Head Explained
Flow rate and total dynamic head form the backbone of pump curve interpretation. Flow rate, measured in m³/h, quantifies the volume of fluid moving through the system per unit time. Total dynamic head (TDH) represents the total equivalent height a pump can lift fluid, combining static head from elevation differences, pressure head at suction and discharge points, and friction losses throughout the piping.
TDH calculation requires adding suction head, discharge head, and friction losses together. Suction head accounts for liquid level relative to the pump inlet. Discharge head covers elevation difference to the outlet plus any back pressure. Friction losses capture energy dissipated through pipe roughness, viscosity effects, and flow restrictions from fittings and valves. Underestimate friction losses, and actual performance falls short of expectations. A Heat Conducting Oil Pump handling high-temperature fluids faces different friction characteristics than a cold water application, which changes the system curve shape.
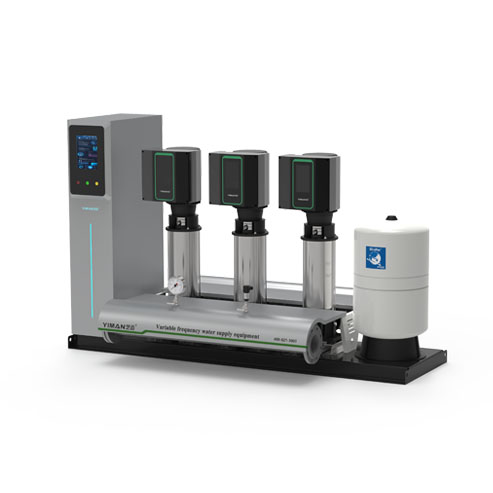
Shanghai Yimai’s booster systems, such as the Intelligent Digital Drived VFD Booster System, optimize these parameters to maintain consistent pressure and flow across varying demand conditions.
How do you calculate pump head and flow?
Start with the required flow rate based on process demand. Calculate static head as the vertical distance between suction and discharge levels. Quantify friction losses using pipe diameter, length, material roughness, and fitting counts. Add any pressure requirements at the discharge point. The sum gives you total dynamic head. Plot this against flow rate to create your system curve, then overlay it on candidate pump curves to find suitable matches.
Efficiency, Power, and NPSH Considerations
Pump efficiency directly affects operating costs. It measures the ratio of hydraulic power delivered to the fluid versus mechanical power supplied to the shaft. Higher efficiency means less energy wasted as heat and vibration. Brake horsepower (BHP) represents actual power consumed by the pump. Lower BHP at a given flow and head indicates better efficiency.
Net Positive Suction Head (NPSH) determines whether a pump can operate without cavitation. When suction pressure drops too low, vapor bubbles form in the fluid and collapse violently inside the pump, eroding impeller surfaces and degrading performance. NPSH required (NPSHr) is a pump characteristic that increases with flow rate. NPSH available (NPSHa) depends on your system layout. Keep NPSHa above NPSHr with adequate margin, and cavitation stays off the table.
Variable frequency drives (VFDs) improve efficiency by matching pump speed to actual demand rather than running at full speed continuously. Optimized impeller geometry also contributes to better hydraulic efficiency.
What factors affect pump efficiency?
Mechanical losses come from bearing and seal friction. Hydraulic losses result from fluid turbulence and friction inside the casing and impeller passages. Volumetric losses occur through internal leakage paths. Improving impeller design, maintaining wear ring clearances, using high-efficiency motors (IE3 or IE4 rated), and keeping the pump near its best efficiency point all contribute to better overall performance.
What is the significance of NPSH on a pump curve?
The NPSHr curve shows minimum suction pressure needed to prevent cavitation at each flow rate. As flow increases, NPSHr typically rises. System designers must ensure NPSHa exceeds NPSHr across the entire operating range. Falling below this threshold causes vapor bubble formation, leading to noise, vibration, and erosion damage. Proper suction piping design with adequate diameter, minimal fittings, and appropriate submergence maintains healthy NPSHa values.
Matching Pumps to System Requirements
Effective pump selection requires plotting both pump and system curves on the same axes. The system curve shows total head required at various flow rates, accounting for static lift and friction losses that increase with flow. Where these curves cross defines the operating point.
Shanghai Yimai’s VFD Controlled Booster System adjusts pump speed automatically to track changing system demands, keeping operation near the best efficiency point. This matters for applications ranging from residential water supply to industrial process systems where demand fluctuates throughout the day.
For high-flow applications, parallel pump operation adds capacity while maintaining head. For high-head requirements, series pump operation stacks pressure capability. Complex systems benefit from pump selection software that models multiple scenarios.
For further insights into selecting the right pump for your specific needs, we recommend reading our guide on 《Picking the Right Water Pump A Step by Step Selection Guide》.
Using Pump Curves for Troubleshooting and Maintenance
Pump curves serve as diagnostic baselines. When actual performance deviates from the expected operating point, something has changed in the pump or system. Lower flow at a given head suggests impeller wear, suction line blockage, or a partially closed valve. Higher flow with reduced head points toward impeller damage or an oversized pump for the application.
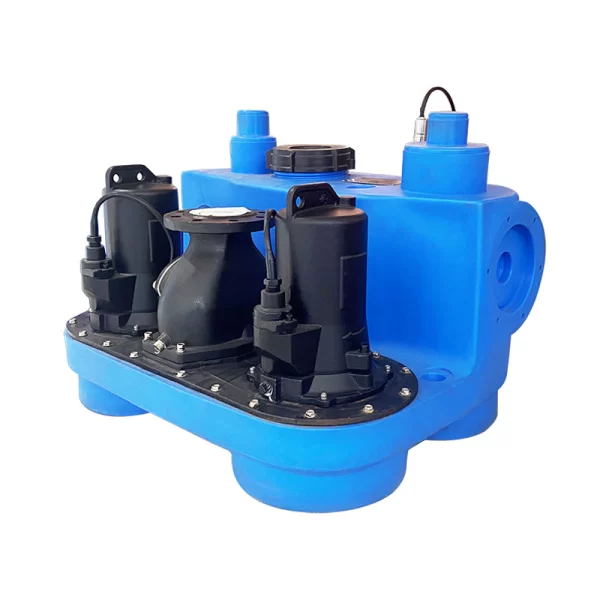
Regular performance monitoring against original curve data catches degradation early. Replacing worn components or cleaning filters before problems escalate prevents unplanned downtime. A Sewage Water Elevating System experiencing reduced flow often has debris accumulation that shows up clearly when comparing current performance to the baseline curve.
| Problem Indication on Pump Curve | Potential Cause | Solution |
|---|---|---|
| Reduced Flow/Head | Impeller wear, clogged filter | Inspect/replace impeller, clean filter |
| Increased Power Consumption | Bearing friction, misalignment | Lubricate bearings, realign pump |
| Unstable Operation | Cavitation, air ingress | Check NPSHa, seal integrity |
| Excessive Vibration | Imbalance, cavitation | Balance impeller, ensure adequate NPSHa |
Vibration analysis and thermal imaging complement curve-based monitoring for comprehensive predictive maintenance programs.
Where Pump Technology Is Heading
Pump systems are getting smarter. Integrated sensors and IoT connectivity deliver real-time performance data that feeds predictive analytics. These systems optimize operation continuously, anticipate maintenance needs, and reduce energy consumption without manual intervention.
Digital twin technology creates virtual replicas of physical pumps for simulation and behavior prediction. This allows testing operational changes before implementing them on actual equipment. Shanghai Yimai develops solutions that leverage these capabilities, providing intelligent integrated systems rather than standalone equipment.
Partner with Shanghai Yimai for Advanced Pumping Solutions
Leverage Shanghai Yimai Industrial Co., Ltd.’s extensive experience in advanced pumping solutions. We invite you to connect with our experts for tailored consultations on pump selection, system optimization, or to explore our range of high-performance electrical motors, water pumps, and integrated water treatment systems. Partner with us for reliable, efficient, and sustainable industrial solutions.
Email: overseas1@yimaipump.com
Phone/WhatsApp: +86 13482295009
Frequently Asked Questions About Pump Curve Analysis
How does a pump curve help in preventing cavitation?
The pump curve includes an NPSHr line showing required suction head across the flow range. Comparing this to your system’s NPSHa reveals whether suction conditions are adequate. If NPSHa drops below NPSHr at any operating point, cavitation becomes likely. This comparison guides both pump selection and suction piping design to maintain safe operating margins.
Can I use a single pump curve for different fluid types?
Standard pump curves assume water at normal temperature. Different fluids require corrections. Viscosity affects both head and efficiency. Higher viscosity reduces delivered head and shifts the best efficiency point to lower flow rates. Specific gravity changes power requirements. For viscous fluids or those with unusual properties, apply correction factors or request curves generated for your specific fluid.
What is the best efficiency point on a pump curve and why is it important?
The best efficiency point (BEP) marks the flow and head combination where the pump operates most efficiently. Running near BEP minimizes energy waste, reduces mechanical stress, and extends equipment life. Operating far from BEP increases wear on bearings, seals, and impellers while consuming more power for the same output. System design should target operation within 80-110% of BEP flow for optimal results.